
Why Your Menu Is Losing You Money Right Now
Most restaurant menus are designed by intuition — "this dish sells well" or "the chef loves making this one." Menu Engineering replaces intuition with data.
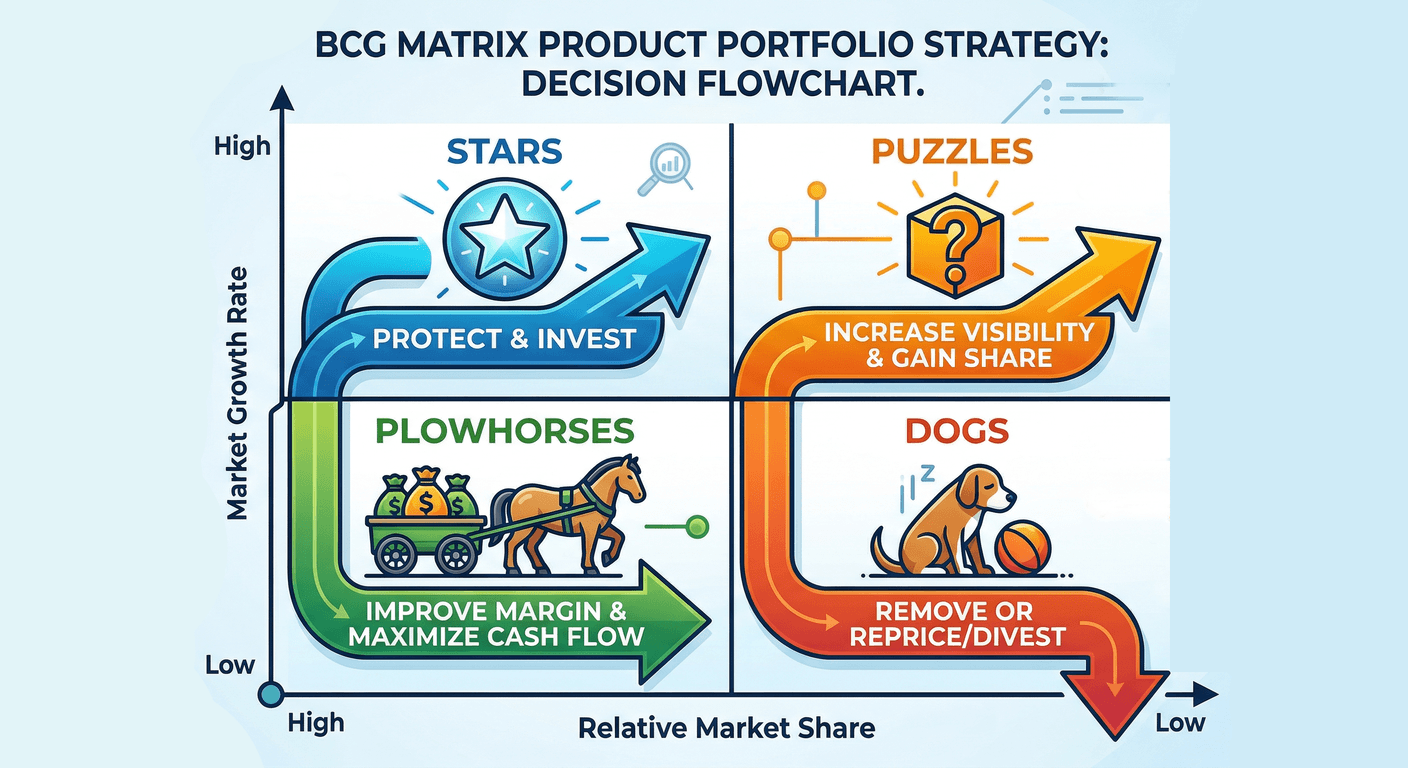
Developed at Michigan State University in 1982, the Menu Engineering Matrix is still the gold standard for menu optimization — used by Michelin-starred restaurants and fast food chains alike. Every dish sits on a 2×2 matrix of profitability and popularity. That position determines exactly what you should do with it.
The Two Axes
The matrix separates popular, profitable, hidden, and underperforming menu items.
Profitability (Profit Score)
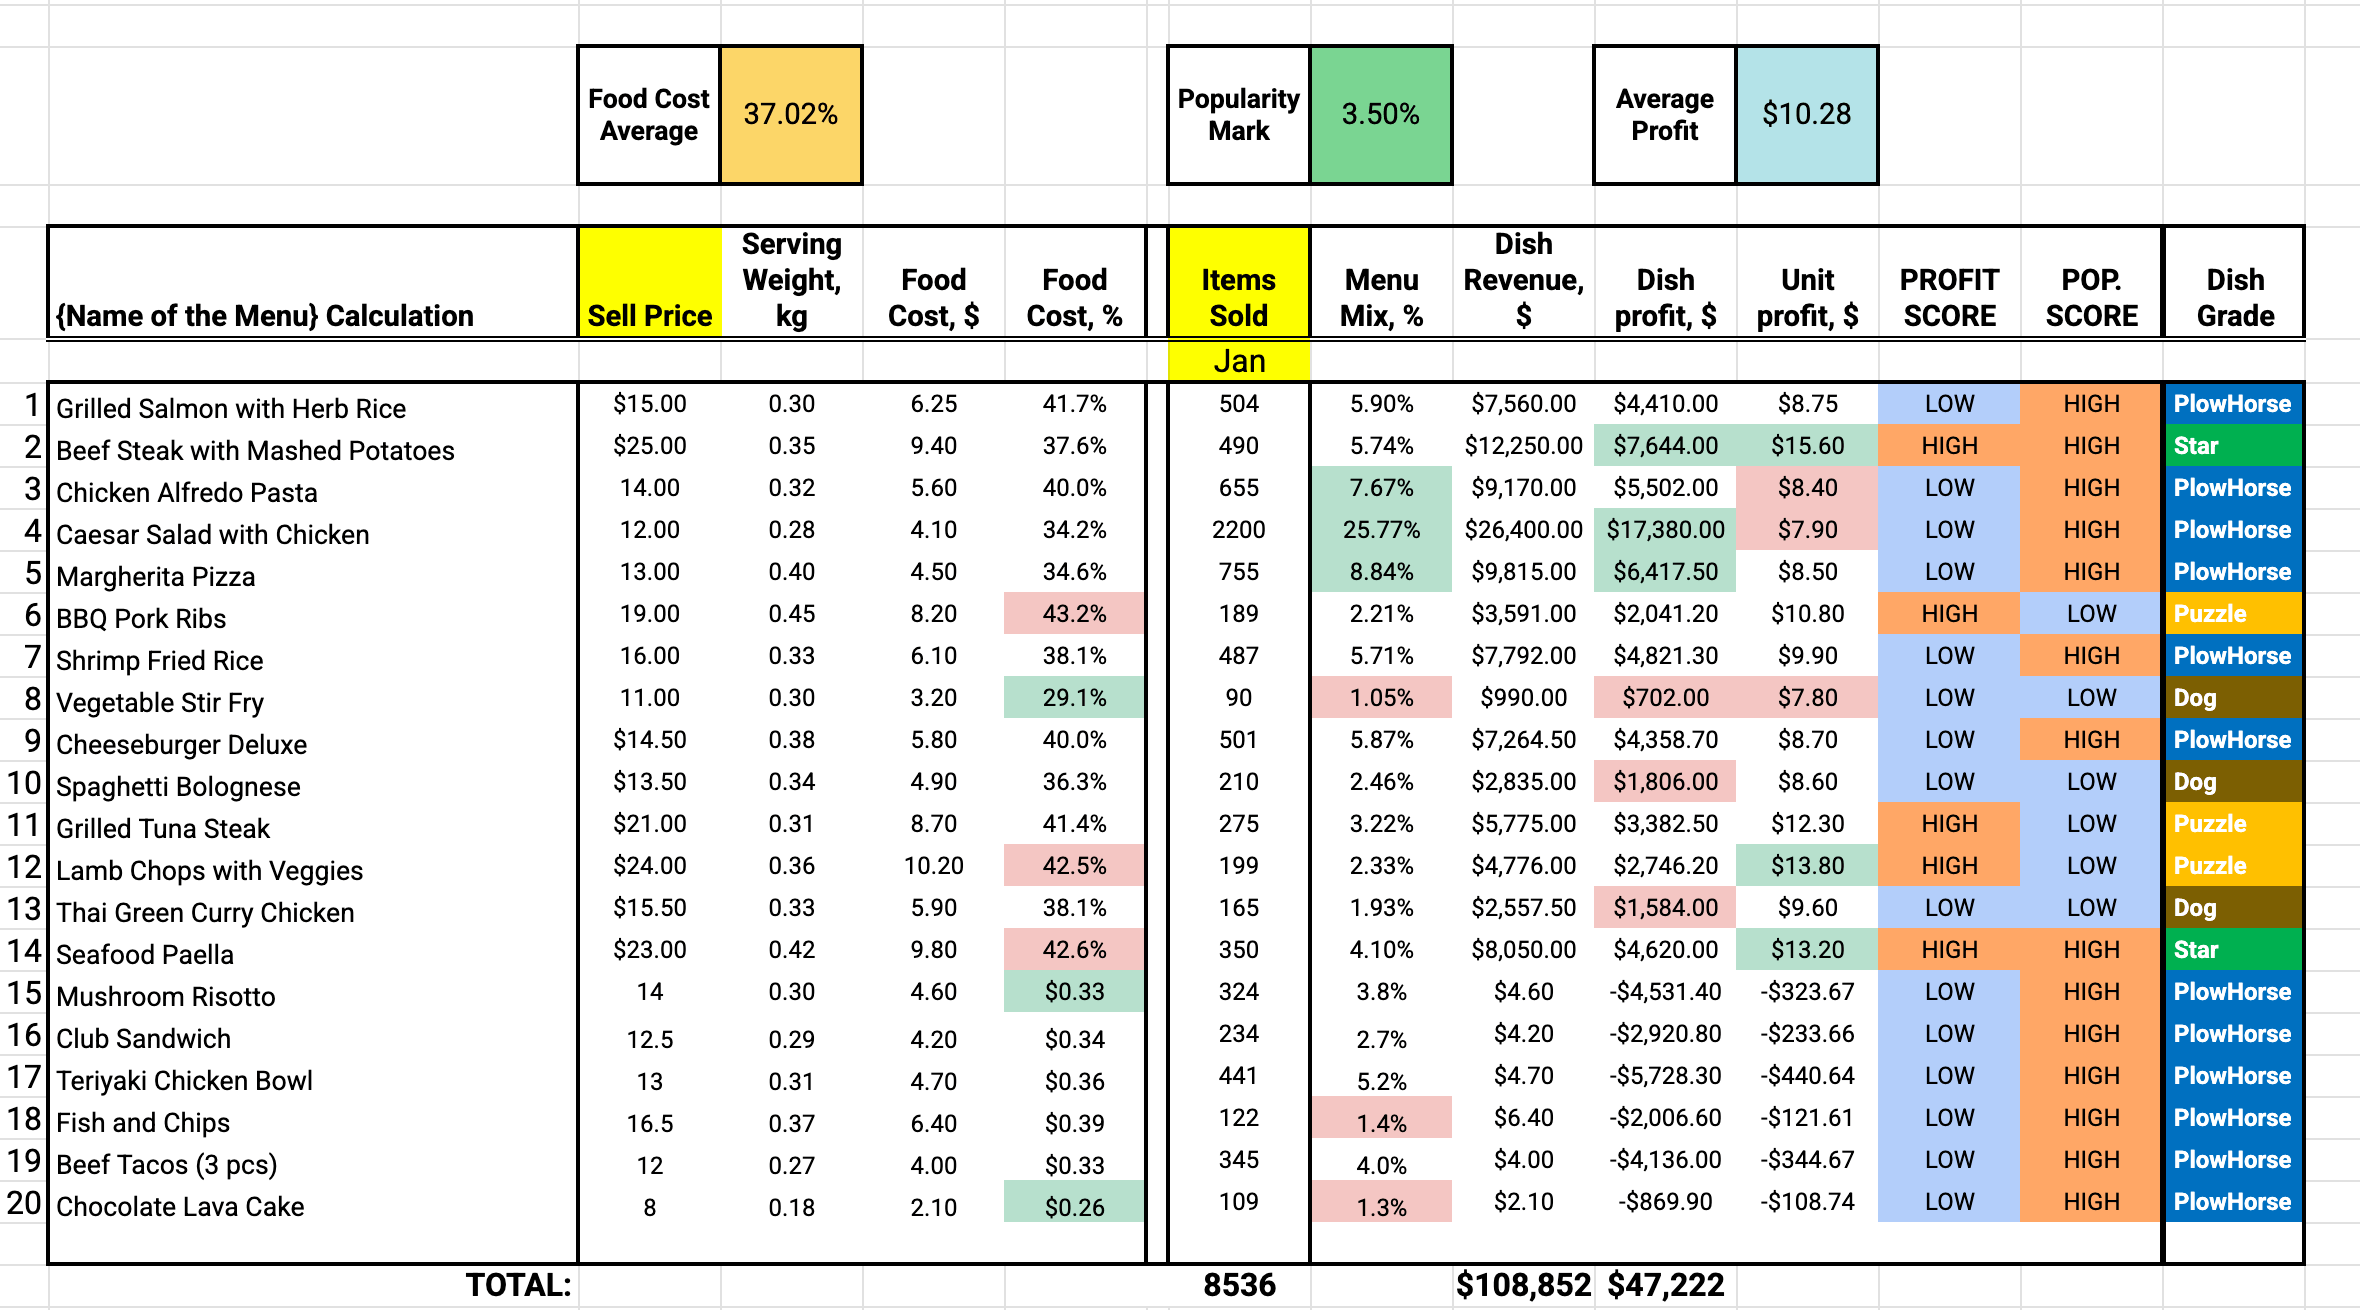
A dish is HIGH profit when its contribution margin (sell price minus food cost) is above the menu average. From our example menu, average profit = $10.28 per dish. A dish earning $15.60 is HIGH; one earning $7.80 is LOW.
This is not the same as food cost %. A dish can have a low food cost % but still be a weak profit contributor if it's priced too low. Always use contribution margin (actual dollars), not percentage.
Popularity (Pop Score)
A dish is HIGH popularity when its menu mix % exceeds the popularity threshold:
Threshold = (100% ÷ number of menu items) × 0.70
For a 20-item menu: (100 ÷ 20) × 0.70 = 3.5% — any dish above this is HIGH popularity.
Dish grades should lead to actions, not just colored labels.
⭐ Stars — High Profit + High Popularity
Examples: Beef Steak with Mashed Potatoes ($15.60 margin), Seafood Paella ($13.20 margin)
Stars are your menu's best assets. They sell well AND make you money. These dishes have loyal fans and solid margins.
- Protect them — don't change recipe, portion, or price without testing
- Promote aggressively — top of menu, photos, staff recommendations
- Watch portion consistency — a 10% heavier serve erodes the margin fast
- Try a small price increase — Stars have inelastic demand; $1–2 often has zero impact on sales
🐴 Plowhorses — Low Profit + High Popularity
Use menu-level views to monitor the dishes that need pricing, promotion, or removal.
Examples: Caesar Salad ($7.90, 2,200 sold), Grilled Salmon ($8.75), Cheeseburger Deluxe ($8.70)
Plowhorses are beloved by guests but not by your P&L. They drive volume but their contribution margin is below average.
- Reduce cost, not quality — review cost card for substitution opportunities
- Increase price carefully — test $0.50–1.00 increase, monitor if sales dip
- Reposition on menu — less prominent placement without removing
- Bundle them — add a high-margin side pairing to increase ticket size
🧩 Puzzles — High Profit + Low Popularity
Examples: BBQ Pork Ribs ($10.80), Grilled Tuna Steak ($12.30), Lamb Chops ($13.80)
Puzzles make great money when someone orders them — but not enough people do. They're either hidden on the menu, poorly named, or just not front-of-mind.
- Rename them — "BBQ Pork Ribs" vs "Slow-smoked 12-hour Ribs with house bourbon glaze"
- Move up the menu — prime real estate = top-right of each section
- Train staff — the highest-converting marketing is a server saying "I'd really recommend this tonight"
- Add photography — visual presentation increases orders by 30%+ for less familiar dishes
🐕 Dogs — Low Profit + Low Popularity
Examples: Vegetable Stir Fry ($7.80, only 90 sold), Spaghetti Bolognese ($8.60), Thai Green Curry ($9.60)
Dogs have neither the margin to justify their place nor the sales to suggest guest demand. They consume menu space, kitchen prep time, and inventory.
- Remove them — a shorter, intentional menu outperforms a long unfocused one
- Reprice and re-evaluate — significant price increase, wait one month, then remove if unchanged
- Investigate why — are they poorly placed, poorly described, or poorly executed?
- Replace with a new dish — every removed Dog is a slot for a potential Star
A Real Example: The 20-Dish Menu
| Category | Count | Key Finding |
|---|---|---|
| ⭐ Stars | 2 | Only Beef Steak & Seafood Paella — the menu needs more |
| 🐴 Plowhorses | 12 | Dominant — high volume, all need margin work |
| 🧩 Puzzles | 3 | Great margins — BBQ Ribs, Tuna, Lamb — need promotion |
| 🐕 Dogs | 3 | Candidates for removal or repricing |
Critical finding: Three dishes (#15 Mushroom Risotto, #16 Club Sandwich, #17 Teriyaki Bowl) show negative dish profit — the sell price is below food cost. These need immediate repricing or removal regardless of category.
The Numbers Behind the Matrix
| Metric | Formula |
|---|---|
| Food Cost % | (Food Cost $ ÷ Sell Price) × 100 |
| Contribution Margin | Sell Price − Food Cost $ |
| Menu Mix % | (Dish sales ÷ Total sales) × 100 |
| Popularity Threshold | (100 ÷ # of menu items) × 0.70 |
| Average Contribution Margin | Total CM ÷ # of menu items |
Ready to run menu engineering on your menu?